Measuring copy performance in the cloud
Written by fractos

I’ve been investigating what kind of transport speeds can be expected when copying files from Amazon S3 buckets to the local filesystem of an Amazon EC2 instance which is provided by EBS (Elastic Block Storage). This has involved testing both the command-line interfaces to AWS operations and also the .Net SDK.
The purpose of this article is merely to collect and present data. Conclusions could be drawn from the results of these tests, and (spoiler alert) there is certainly one big take-away, but some of the things I also found interesting were in the details and surprises of the memory and CPU performance changes that were observed.
Specifically, I’ve been considering a collection of one hundred JPEG2000 files of various sizes. These were chosen at random from a cross-section of the image cache used by the Wellcome Library’s viewer. JPEG2000 files tend to be highly compressed, so any compression performed by the transport within AWS should have a negligible effect.
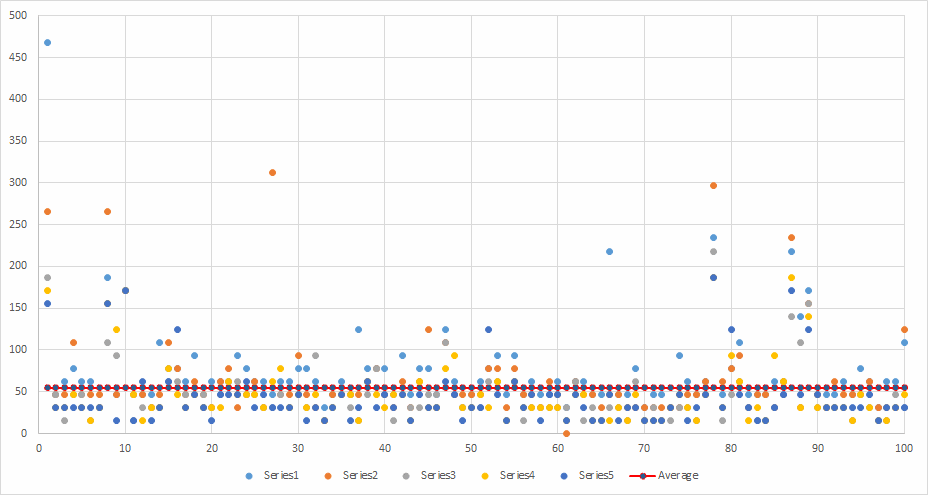
As you can see from this scatter graph, there was a pretty random spread of file sizes within the sample.
- Maximum file size was 10924380 bytes
- Minimum was 112336 bytes
- Average was 1562048 bytes

I tested this on a t2.medium EC2 instance which had GP2 EBS (general purpose SSD) storage attached to it.
Tests
Fast and efficient transport from S3 to the local filesystem is critical for scalability in the DLCS architecture and this is the operation that I wish to measure. S3 bucket storage is cheap and plentiful but comes at the cost of only having access via HTTP operations, whereas the Elastic Block Storage on EC2 is more expensive, implemented using fast SSD devices and is attached as a full filesystem.
So, here’s what we are testing:
S3 bucket -> (transport within AWS) -> EC2 instance with EBS
The test harnesses I am using use both the ‘aws’ CLI tool and the .Net SDK to copy files from the S3 bucket to a local filesystem. Each harness can do this in a number of different ways:
- Serial - one at a time
- Parallel with TPL - using the .Net Task Parallel Library, started as Long Running tasks
- Parallel.Invoke with Saturation - setting MaxDegreeOfParallelism to be equal to the number of operations thereby saturating the CPU
- Parallel.Invoke with Limitation - setting MaxDegreeOfParallelism to be equal to the number of physical CPU cores
- Staccato - Queuing and delaying tasks in a random fashion (up to X seconds where X = total number of files) so they may execute in parallel and is more like a model of general use
All test methods measure each individual transfer and the overall time taken, writing it out to a .csv file at the end of processing.
Results
CLI
First up, the CLI application ‘aws’ which is used like this:
aws s3 cp s3://<bucket-name>/<key> <local-filename>
CLI - Serial
Runs: 5 Minimum: 1014 ms Maximum: 2511.6 ms Average: 1115.556 ms
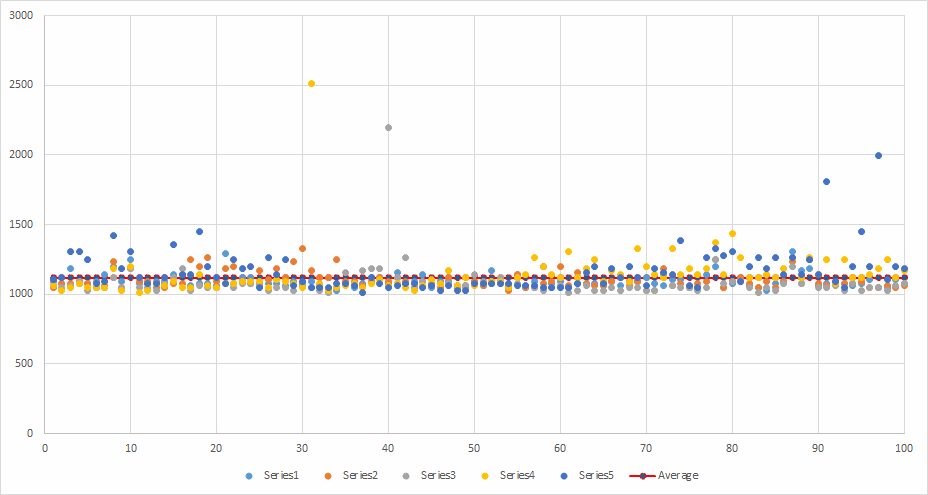
Very slow going at over a second per file.
CLI - Parallel with TPL
Runs: 5 Minimum: 1903.2 ms Maximum: 53944.8 ms Average: 27376.1 ms Average total time per run: 54712.32 ms

Entertainingly awful times. Also, worth a look at the performance entry for this scenario, below.
CLI - Parallel.Invoke with Saturation
Runs: 5 Minimum: 1186.6 ms Maximum: 8252.4 ms Average: 4245.166 ms Average total time per run: 54378.48 ms
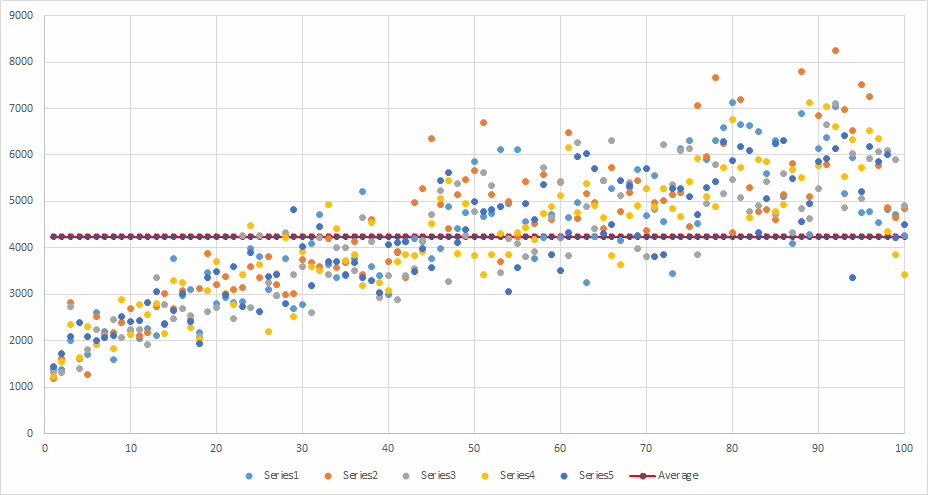
As resources diminished, the times grew steadily worse.
CLI - Parallel.Invoke with Limitation
Runs: 5 Minimum: 1045.2 ms Maximum: 2948.4 ms Average: 1168.534 ms Average total time per run: 58612.32 ms
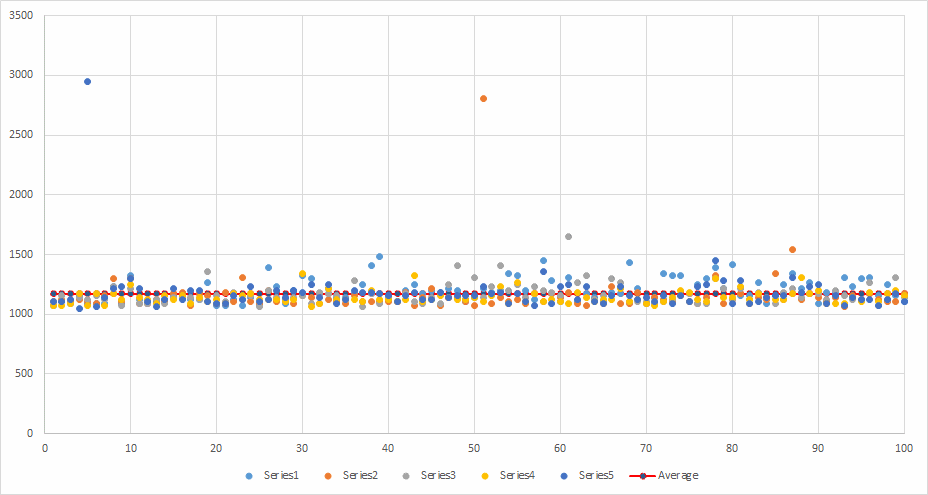
Roughly comparable to running in serial.
CLI - Staccato
Runs: 1 Minimum: 1045.2 ms Maximum: 3728.4 ms Average: 1544.4 ms
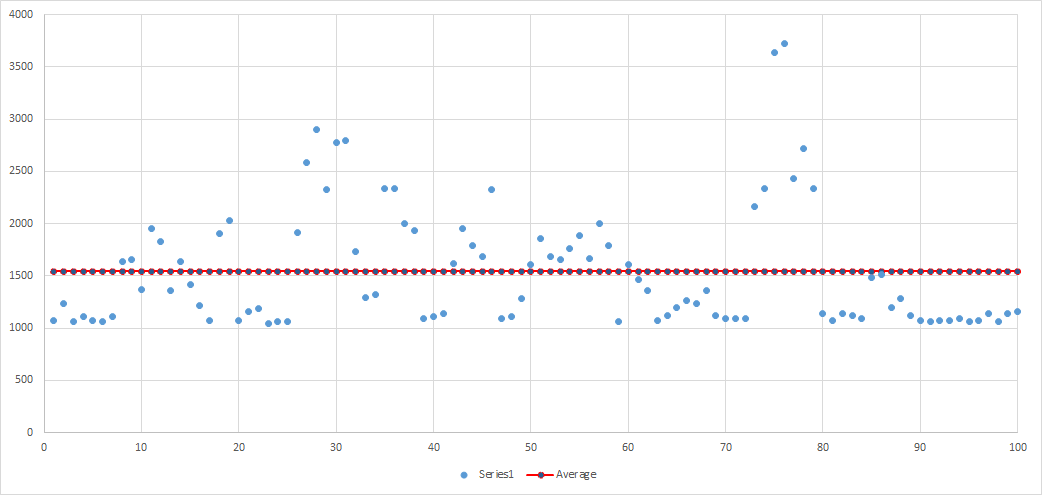
Again, roughly comparable with the serial results.
.Net SDK
This used the AWSSDK Nuget package, and specifically the Amazon.S3.Transfer.TransferUtility helper class to fetch files from S3 storage as streams and record those to the local filesystem as the expected filename. Each of the five runs per test used the same TransferUtility object during the one hundred fetches. I tested both using a fresh AWS client for each operation and also keeping an ambient client that was warmed up with a simple fetch of a 5 byte text file at the beginning of each run which removed the small increase in time as it set up various aspects of the connection.
.Net SDK Serial - no warm-up
Runs: 5 Minimum: 15.6 ms Maximum: 486 ms Average: 55.2716 ms
Huge leap in speed! Pretty variable for overall transfer time but that’s a healthy average.
.Net SDK Serial - with warm-up
Runs: 5 Minimum: 15.6 ms Maximum: 327.6 ms Average: 44.2416 ms

The average is well down with only a couple handfuls of files that hit 100 ms or higher for transfer.
.Net SDK Parallel - TPL - no warm-up
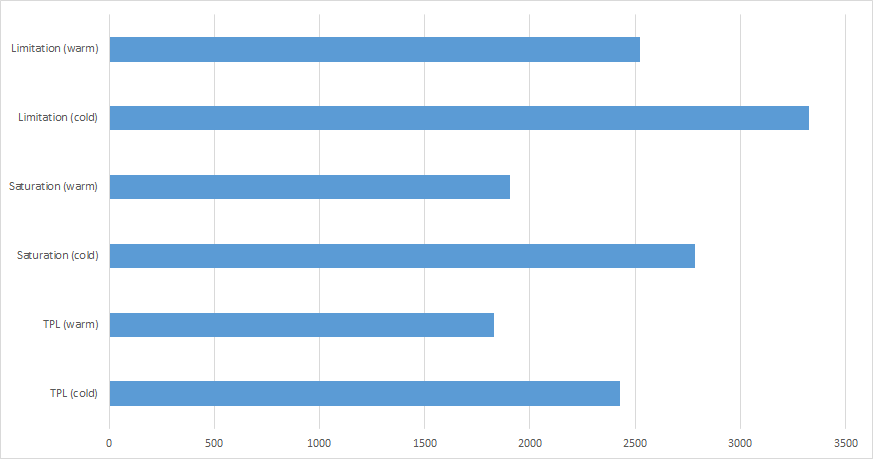
Runs: 5 Minimum: 15.6 ms Maximum: 826.8 ms Average: 138.8464 ms Average total time per run: 2427.36 ms

In TPL scenarios, the time taken for a copy builds up over time. The warm-up process significantly lessens the impact of this as can be seen from the next scenario.
####.Net SDK Parallel - TPL - with warm-up
Runs: 5 Minimum: 15.6 ms Maximum: 1232.3 ms Average: 246.924 ms Average total time per run: 1828.32 ms

A weird graph again for TPL with steadily increasing times for transfers. However, the transfers themselves were much more lightweight than the CLI, so less overhead and more throughput.
.Net SDK - Parallel.Invoke with Saturation - no warm-up
Runs: 5 Minimum: 15.6 ms Maximum: 483.6 ms Average: 67.9648 ms Average total time per run: 2783.04 ms

.Net SDK - Parallel.Invoke with Saturation - with warm-up
Runs: 5 Minimum: 15.6 ms Maximum: 483.6 ms Average: 58.2504 ms Average total time per run: 1906.32 ms

Roughly comparable to the Serial run, however the average total time for 100 files was just under 2 seconds. Again, the warm-up process significantly lessens the average total time per run.
.Net SDK - Parallel.Invoke with Limitation - no warm-up
Runs: 5 Minimum: 15.6 ms Maximum: 312 ms Average: 58.0544 ms Average total time per run: 3325.92 ms

Similar average per file to Parallel.Invoke with Saturation (and warm-up).
.Net SDK - Parallel.Invoke with Limitation - with warm-up
Runs: 5 Minimum: 15.6 ms Maximum: 499.2 ms Average: 49.452 ms Average total time per run: 2520.96 ms

Lower average per file but longer total time. More overhead for setting up and tearing down threads, I suspect.
.Net SDK - Staccato - no warm-up
Runs: 1 Minimum: 15.6 ms Maximum: 468 ms Average: 67.548 ms

Pretty comparable to the serial results.
Test result round-up
Here’s the round up of the data from the test runs. I’ve lumped in the Staccato tests with the Serial tests as the numbers were pretty equivalent.
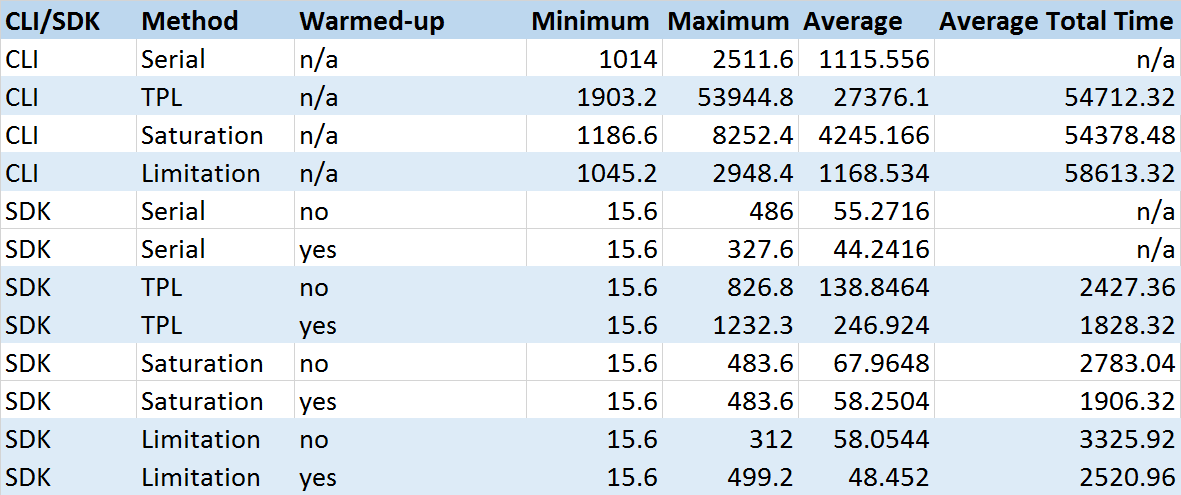
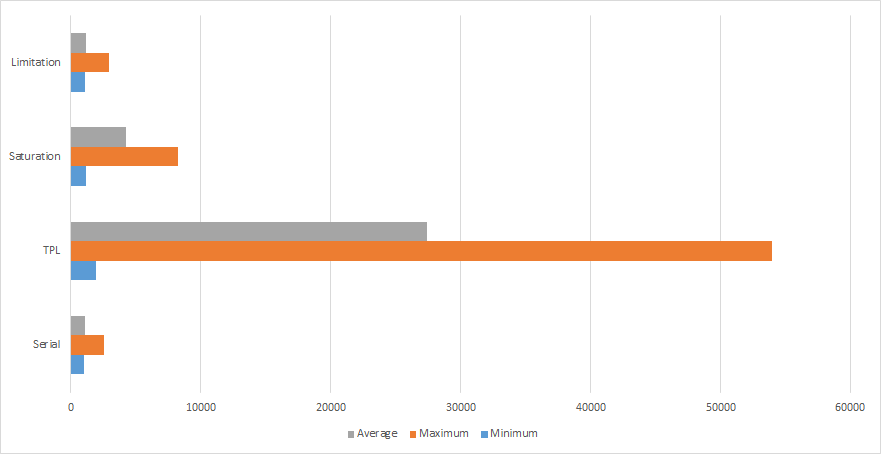
From this we can show the timing spread for the CLI test runs:
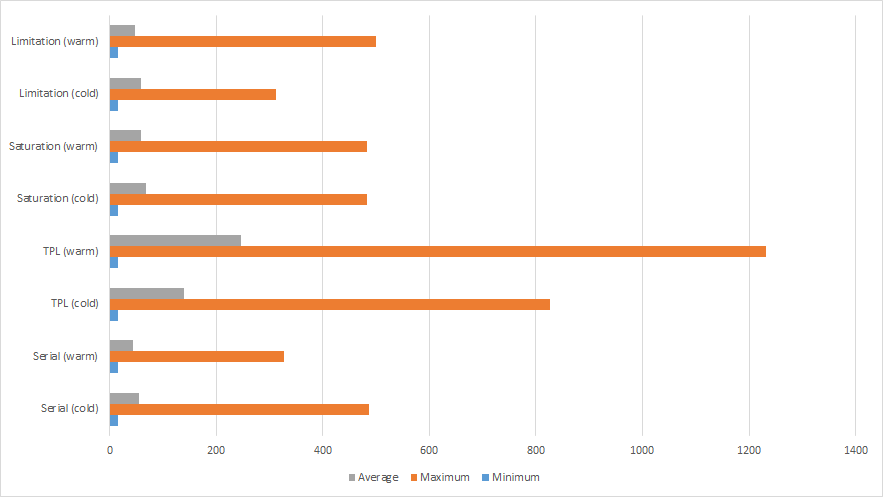
And the SDK test runs:
Then finally, we can show the spread across the average total time taken for tests.

Performance
Now that the results for the transfer numbers have been shown, I’d like to show you a few snapshots of how the machine was actually performing during those tests.
During CLI - Serial and Parallel with TPL
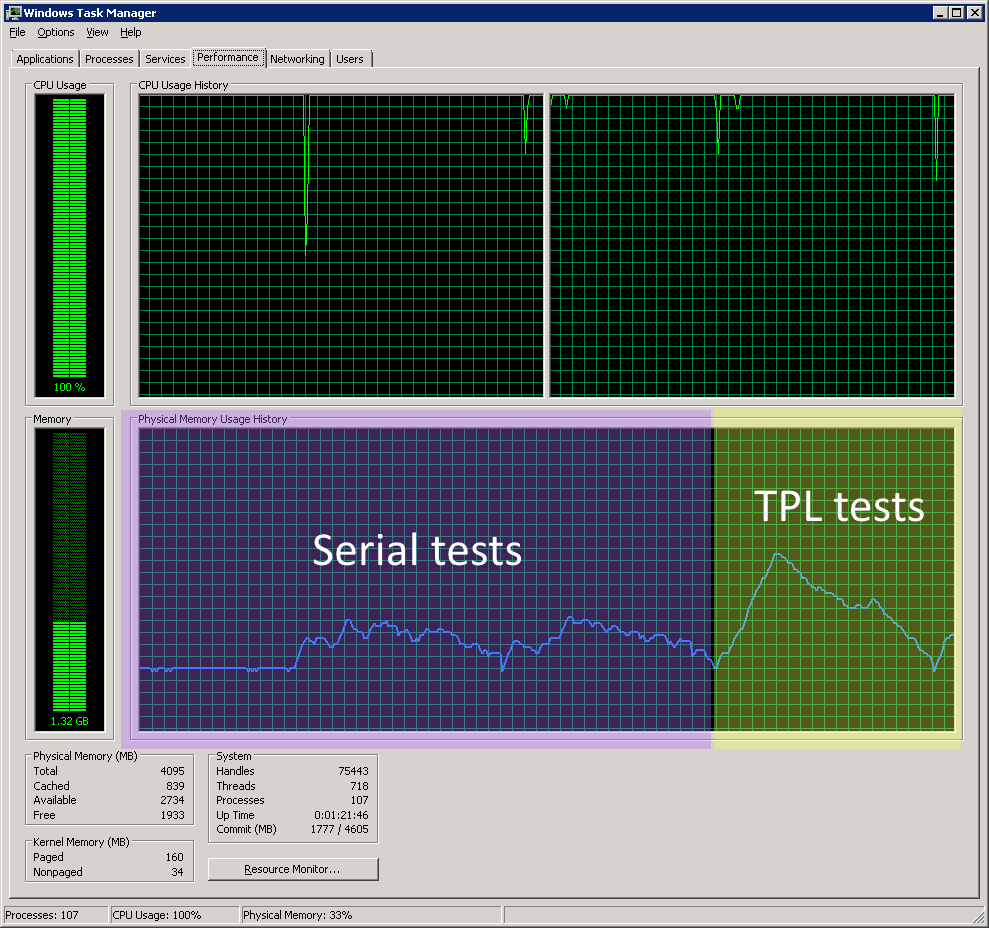
As you can see, the CPU was basically saturated during even the serial test on the CLI and the memory footprint was fairly constant. However, during the TPL test, the memory footprint rose and rose. I don’t know if this behaviour is to be expected when launching a hundred or so long running tasks, or if this is an artefact of what the AWSSDK object is doing within that task. Either way, it’s a little concerning.
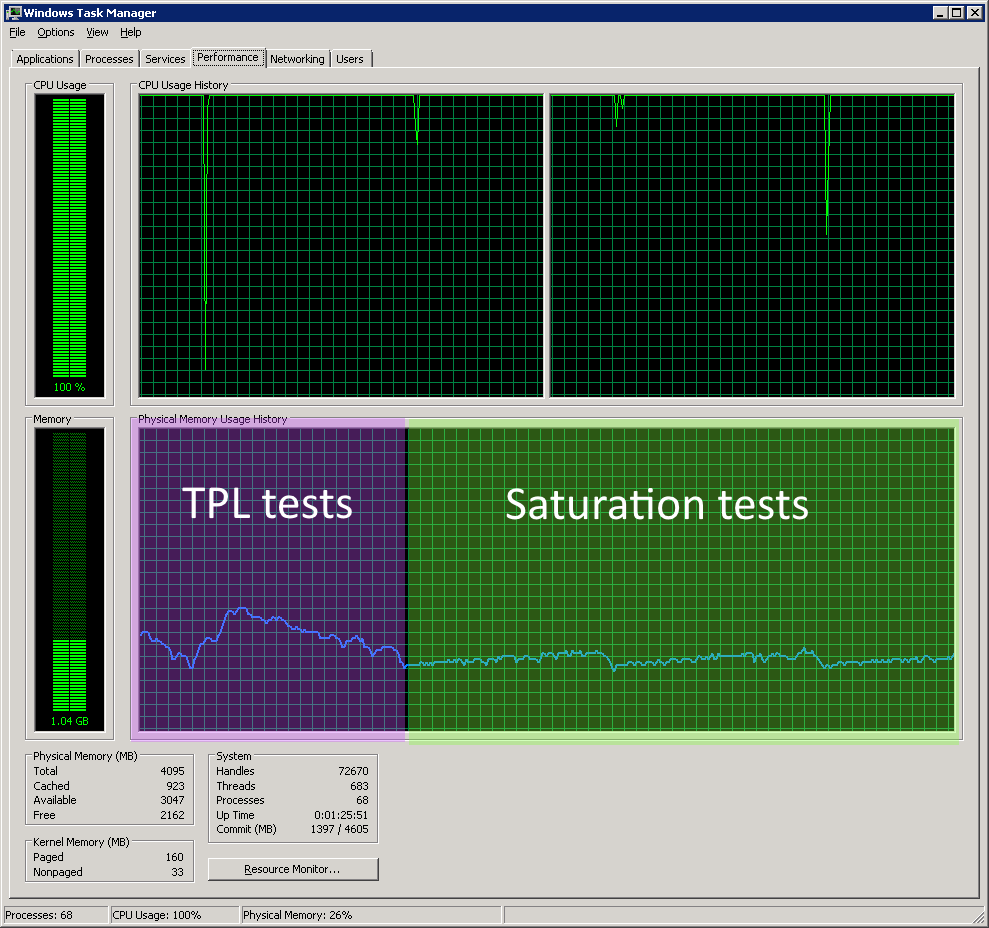
Running Parallel.Invoke with Saturation, i.e. requesting as many threads as there are files to be processed, gives a much better behaved set of performance. The CPU is saturated but the memory footprint is on a much lighter incline followed by a rational-looking clean up at the end of a run.
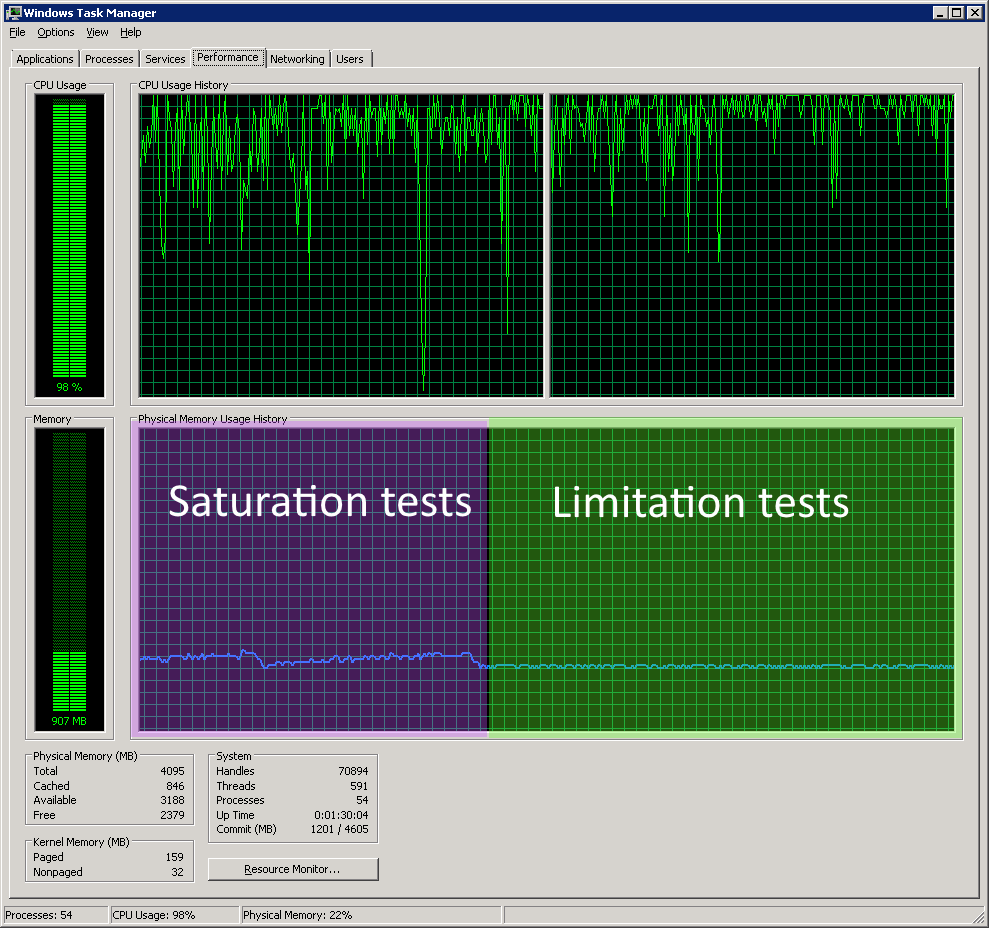
This showed that limiting the MaxDegreeOfParallelism to the number of physical CPU cores in the server gave a much smoother experience. The memory footprint was basically flat and the cores were keeping at an average of maybe 90% utilisation; more than enough to let the system tasks do their thing while the application is running.
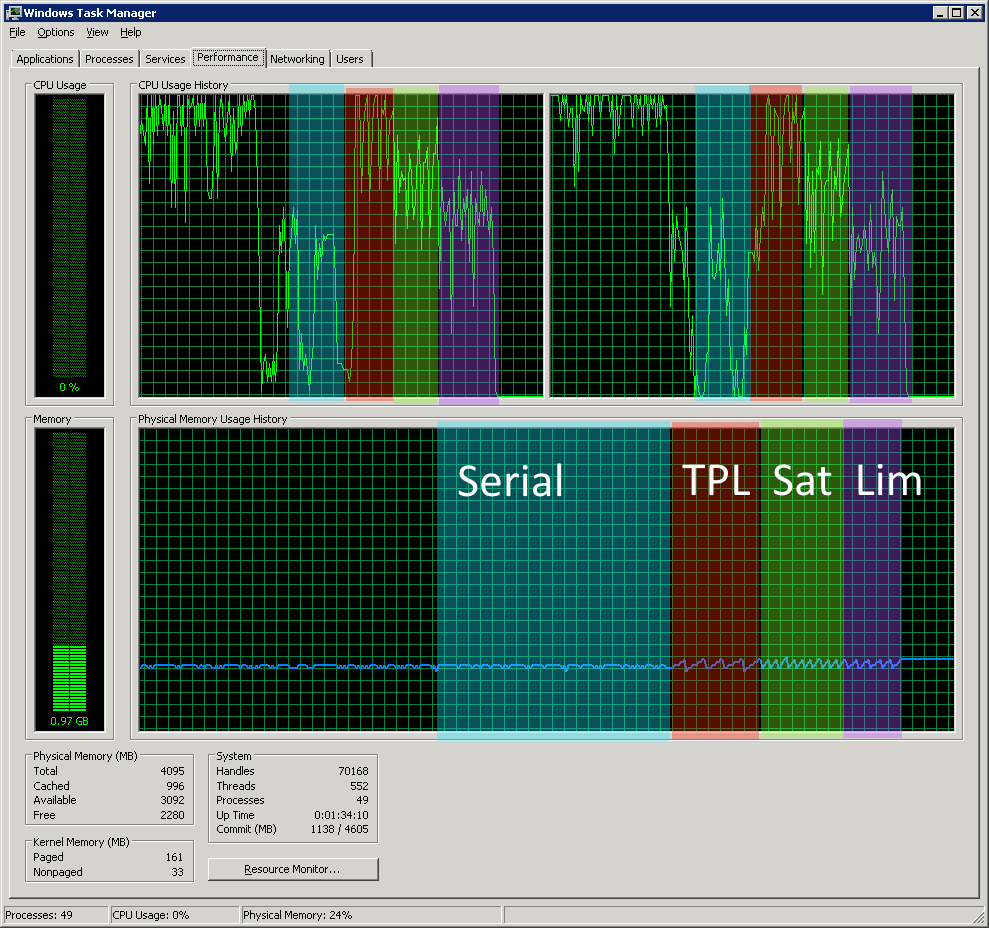 (The zoning of that graph involves some guesswork for the serial section and the split between the Saturation and Limitation sections.)
That all said, the performance during the SDK test runs can be shown all in one graph. Behaviour during the SDK serial tests was barely breaking 50% CPU utilisation and the memory was not getting touched at all. During the TPL tests, the sawtooth pattern that I saw in the CLI test for TPL re-occurs but because the task itself is over so quickly, the memory doesn’t have time to build up as much. CPU activity during the TPL test was higher on average than either the Saturation or Limitation tests. Speaking of which, both Saturation and Limitation tests were very well behaved although I expected the Saturation tests to have a much higher CPU utilisation. The efficiency of the .Net SDK has definitely surprised me.
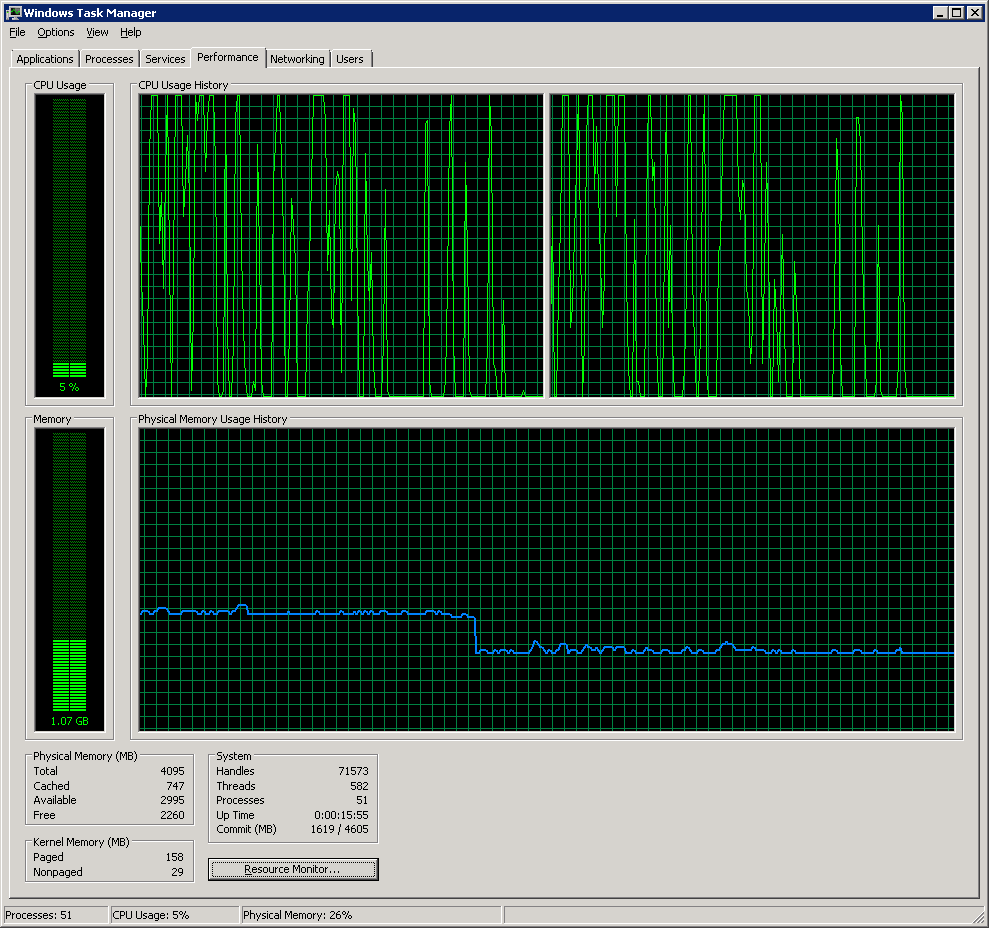
Behaviour was quite bursty with the CLI, as I’d imagined it might be. The memory footprint was pretty constant though (ignore the left half of the memory graph please!).
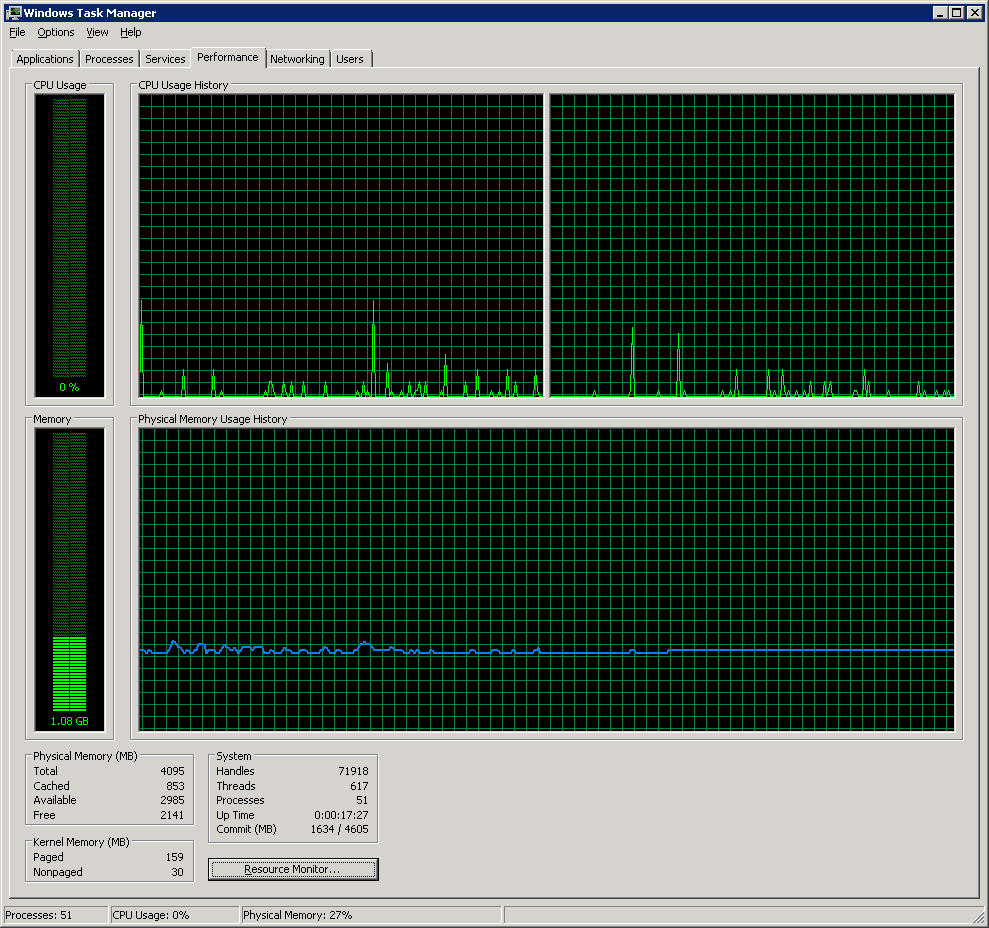
The machine was barely touched, running still as a pond with a flat memory impact. This was nice to see for what is felt is a more representative usage pattern, even if it didn’t have a warmed-up client.
Conclusion
For JPEG 2000 files typical of digitised library use, you can get a transfer time from S3 to EBS storage on AWS of about 50ms if you use the right techniques. This opens up more architectural options for cloud-based IIIF image endpoints.
Specifically, using a warmed-up SDK client (Java was untested but is assumed to be at least comparable to the .Net SDK client) and a parallel method of initiating file copy operations appears to offer balanced performance when also considering the impact upon the machine’s general utilisation.